
Custom and Configurable Data-visualization? Yes, please.
Grafana is a data visualization tool that pulls in metrics from several data sources. For our purposes, we’ll be using influxdb, which is a database that is geared towards time-based metrics.
For this instance, I’m using a template within Proxmox, specifically debian-9.0-standard_9.3-1_amd64.tar.gz on a 64-bit platform. However, so long as you have a modern-ish version of Debian, this guide should work just as well. We’ll be using the CLI for the majority of our configurations, and assuming you’ve issued the superuser (su) to root. If not, prefix your commands with “sudo”.
NOTE: I don’t go over securing this setup. I plan on updating this guide with security enhancements. Avoid using this in a production environment without adding security features!
Whenever starting a new system, always perform a quick update:
apt-get update && apt-get upgrade -y
Install influxdb
apt-get install influxdb
Edit your influxdb config file:
nano /etc/influxdb/influxdb.conf

Uncomment and edit the [udp] section to reflect the following:
[[udp]]

enabled = true

bind-address = "0.0.0.0:8089"

database = "proxmox"

batch-size = 1000

batch-timeout = "1s"
NOTE: The database can be named anything, just make sure you remember what you called it when you add the data source in Grafana. Also, the port can be anything you wish, just make sure it’s available on your network and matches your entry in the proxmox’s status.cfg later in the guide.
Look here for the latest release: http://docs.grafana.org/installation/debian/
Use wget to download that file to your instance (we’ll be pulling the current version at the time: 5.0.1):
wget https://s3-us-west-2.amazonaws.com/grafana-releases/release/grafana_5.0.1_amd64.deb
Use dpkg to install it:
dpkg -i grafana_5.0.1_amd64.deb
Edit server definitions on your pve node by creating the file “/etc/pve/status.cfg”.
nano /etc/pve/status.cfg
Add the following (make sure your port matches your entry in the influxdb.conf):
influxdb:

server your-server-ip-address

port 8089

Finally, start your services and make then run on boot:
service influxdb start

service grafana-server start

systemctl enable influxdb

systemctl enable grafana-server
Navigate to your instance’s http://your-server-ip-address:3000. You should be presented with a login screen

The default username and password for Grafana is admin:admin
Once you login, you’ll be asked to configure your data source:

Clicking “Save & Test” should confirm Grafana’s connection to Influxdb.

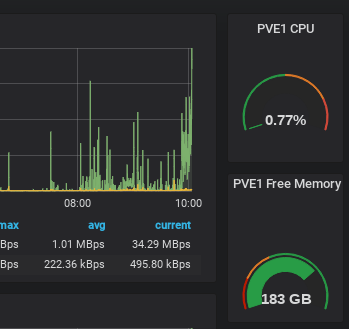
You should now be able to create graphs using the data pulled from Proxmox! You can experiment with the data sets by creating a new dashboard and then adding a new panel. I’ll give you an example of one of my “SingleStat” panel configurations; I use it to pull the CPU usage from a Proxmox host.


Good article. Unfortunately, I can’t seem to successfully retrieve stats from PVE / InfluxDB. Any suggestions on debugging?
Will,
Sorry for the late response. Did you ever get this sorted out?
Thank you. Very helpful.
Thank you for the helpful tutorial. Where can I get a list of all the InfluxDB column values? In other words, I have no idea what to put under the metrics tab.
InfluxDB itself is simply a database that captures whatever details the device sends it. The column values will vary. Honestly, I just poked around until I was able to get some useful data.
Sweet. Great write-up and works flawlessly on proxmox 5-2. Thanks much.