Skip to content
Jon Spraggins

Jon Spraggins

I build. I tinker. I break.

  • Email
  • Twitter
  • Instagram
  • Github
  • LinkedIn
  • Home
  • About
  • Projects
    • One Stop Search

Recent Posts

  • A few HTTP Status Codes for the Vulgar-Minded
  • The Idiot considers his white privilege
  • The Idiot repurposed an old Army Radio

Category: Data Visualization

The Idiot uses Grafana and Influxdb to monitor Proxmox

The Idiot uses Grafana and Influxdb to monitor Proxmox

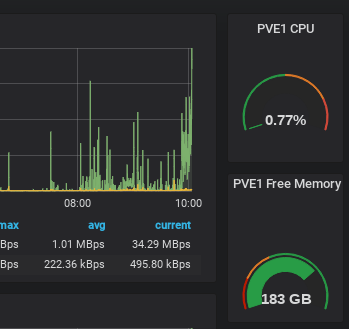
Custom and Configurable Data-visualization?  Yes, please.

Continue reading The Idiot uses Grafana and Influxdb to monitor Proxmox

Posted on March 16, 2018March 11, 2020Categories Data Visualization, Proxmox, TechTags debian, grafana, influxdb, Proxmox6 Comments on The Idiot uses Grafana and Influxdb to monitor Proxmox
Proudly powered by WordPress